In Summary:
- 38 homes sold with a median sale price of $1,481,200, highlighting a strong luxury real estate market with prices ranging from $790,000 to $2.7 million.
- Well-priced, move-in-ready homes sold significantly faster, with some finding buyers in just 15 days, while overpriced properties often spent months on the market.
- Sellers should price strategically and prepare their homes before listing, while buyers should be ready to act quickly on desirable properties and explore potential off-market opportunities.

By Paige Schulte, Schulte & Co. | Neighborhood Experts Real Estate. Published [DATE]. Sales from January 1 to November 17, 2026; listings as of November 16.
In 2026, 38 homes have sold in Canterwood for a median of $1,481,200. The year split in two: homes that sold from January through May had a median of 115 days on the market, while homes that sold from June on took a median of just 15. Today, four of the nine homes for sale have been listed for more than 85 days. The difference between the homes that sold quickly and the homes that sat is almost always price relative to recent Canterwood sales, condition, and position on the lot. Here is what the numbers show.
Canterwood By The Numbers
| Metric | January 1 to November 17, 2026 |
|---|---|
| Homes sold | 38 (34 on the MLS, 4 off-market) |
| Total sales volume | $57.4 million |
| Median sale price | $1,481,200 | Price range | $790,000 to $2,700,000 |
| Median price per square foot | $436 | Median days on market (MLS) | 41 (115 for January to May sales; 15 since June) |
| Sold within 30 days | 13 of 34 MLS sales (38%) |
| For sale on November 16 | 9 homes, median asking price $1,425,000 |
| Under contract on November 16 | 3 homes |
| Months of supply | About 2.5 |
What sold: well-priced homes went fast
Canterwood rewards a well-priced launch. Thirteen of the 34 homes sold through the MLS this year spent 30 days or fewer on the market, and eight sold at or above their asking price, five of them within 15 days. The strongest result was on Old Stump Drive, where a home sold for $2,249,000, 2.3% over asking, after 15 days.
Homes that sold within 30 days closed at a median 98.5% of their original asking price. Homes that took longer closed at 94.5%. On a $1.5 million Canterwood home, that difference is about $60,000. Fourteen of the 34 MLS sales, 41%, cut their price before selling.


What sat: asking prices ahead of the market
The slow start to the year shows what happens when price and season work against a listing. The 13 homes that sold from January through May had a median of 115 days on the market and closed at a median 94.5% of their original price, often after price cuts. The nine homes for sale on November 16 had a median of 52 days on the market, and four of them had been listed for more than 85 days.
The reason shows in the asking prices. Active listings are asking a median $456 per square foot, about 5% above the $436 per square foot Canterwood buyers have paid in 2026. Two homes that finally went under contract in late October and November had been on the market 127 and 137 days, and both reduced their price first.
Why: what sets value in Canterwood
Price per square foot in Canterwood ranged from $256 to $617 in 2026, more than a two-to-one spread inside one community. In my experience, three things explain most of it:
Condition. This is the biggest factor. Remodeled, turnkey homes can sell for up to $200 more per square foot than homes that need cosmetic updates. Buyers compare closely within the community, so the updated homes set the price for everyone else.
Position and layout. Golf course frontage and fairway views, privacy, western or southwestern exposure, true one-story living and flat driveways all bring a premium.
Price tier. Homes that sold for $2 million or more brought a median $471 per square foot, compared with $409 for homes under $2 million. At the top of the market, buyers are paying for updated homes in the best positions.
Read more about the community, the club and what to check before buying on our Canterwood Golf & Country Club homes page.
Where Canterwood prices land
| Price range | Sales |
|---|---|
| Under $1.25M | 13 |
| $1.25M to $1.49M | 6 |
| $1.5M to $1.99M | 12 | $2M and up | 7 |
Sales split into two groups: 13 of the 38 sold for under $1.25 million, including four on West Old Stump Drive, and 12 sold between $1.5 million and $2 million.
The top of Canterwood trades privately
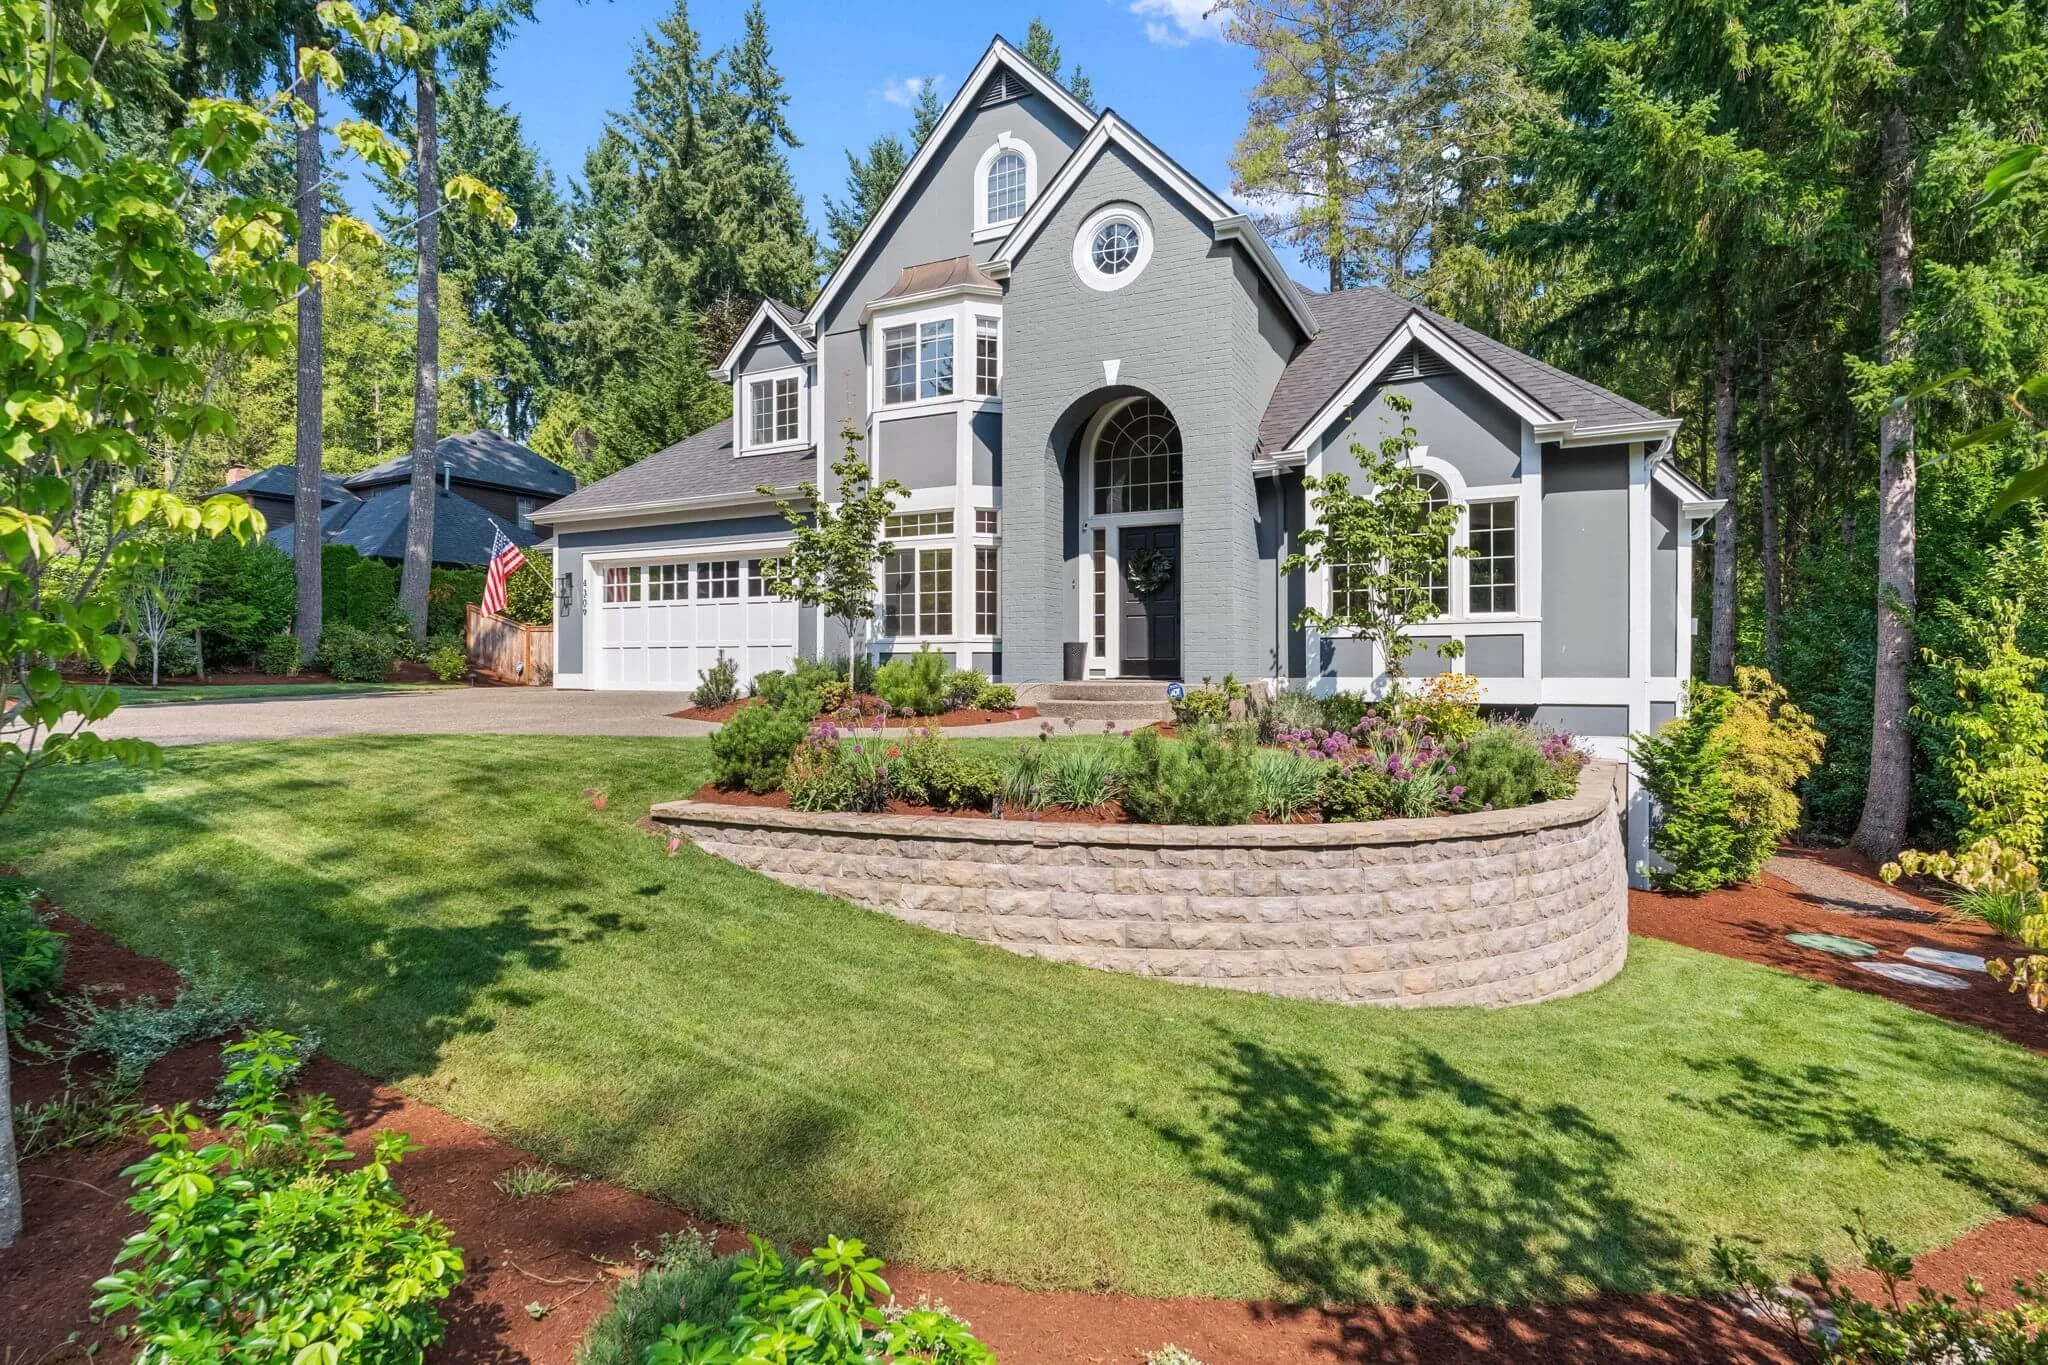
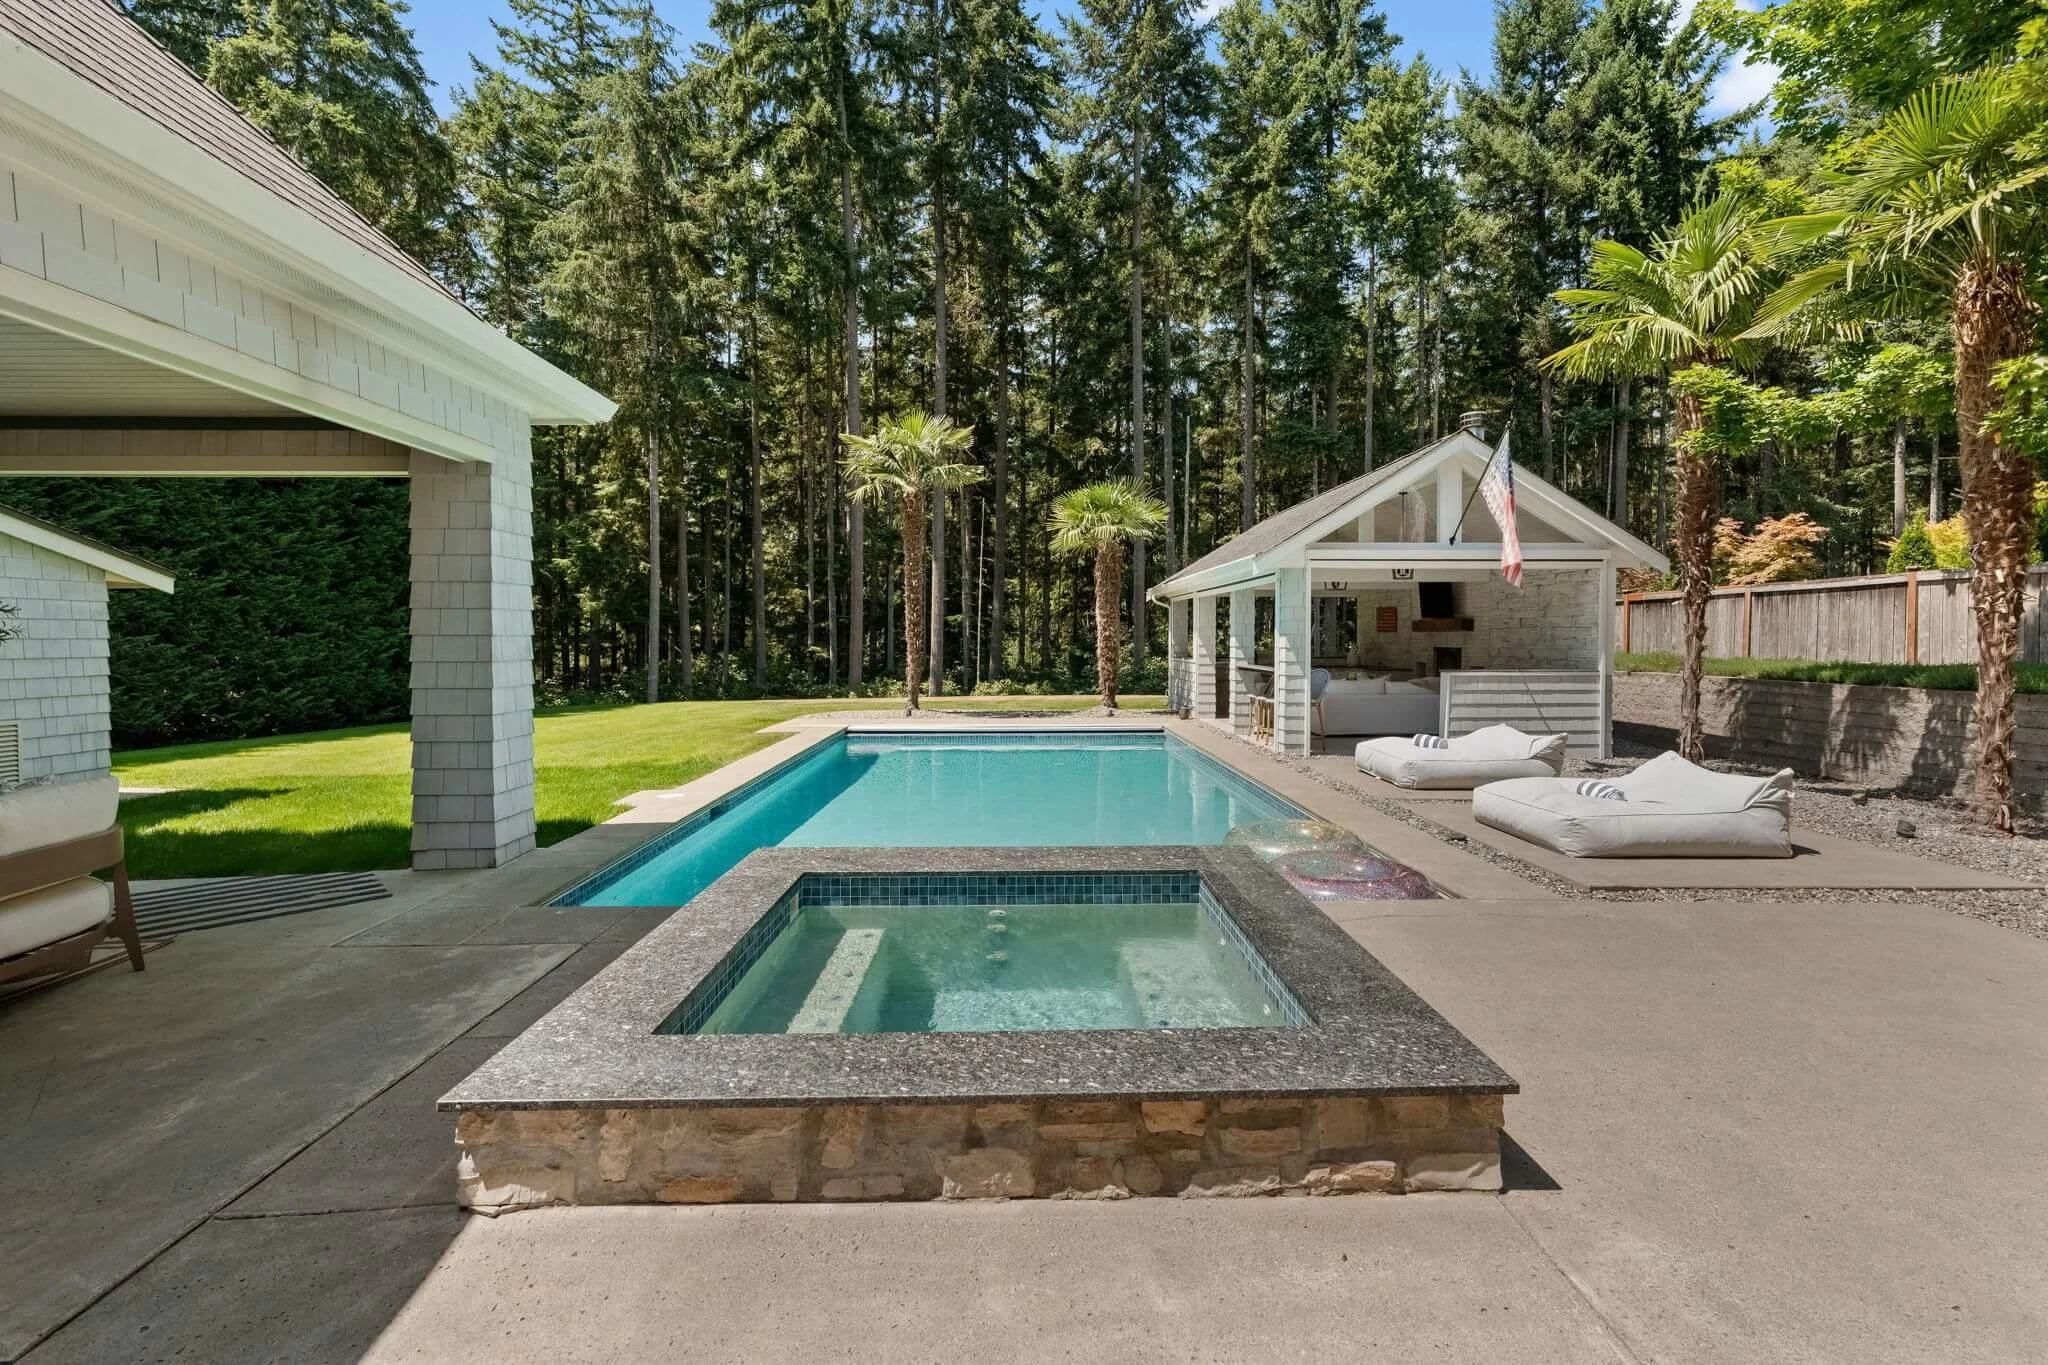
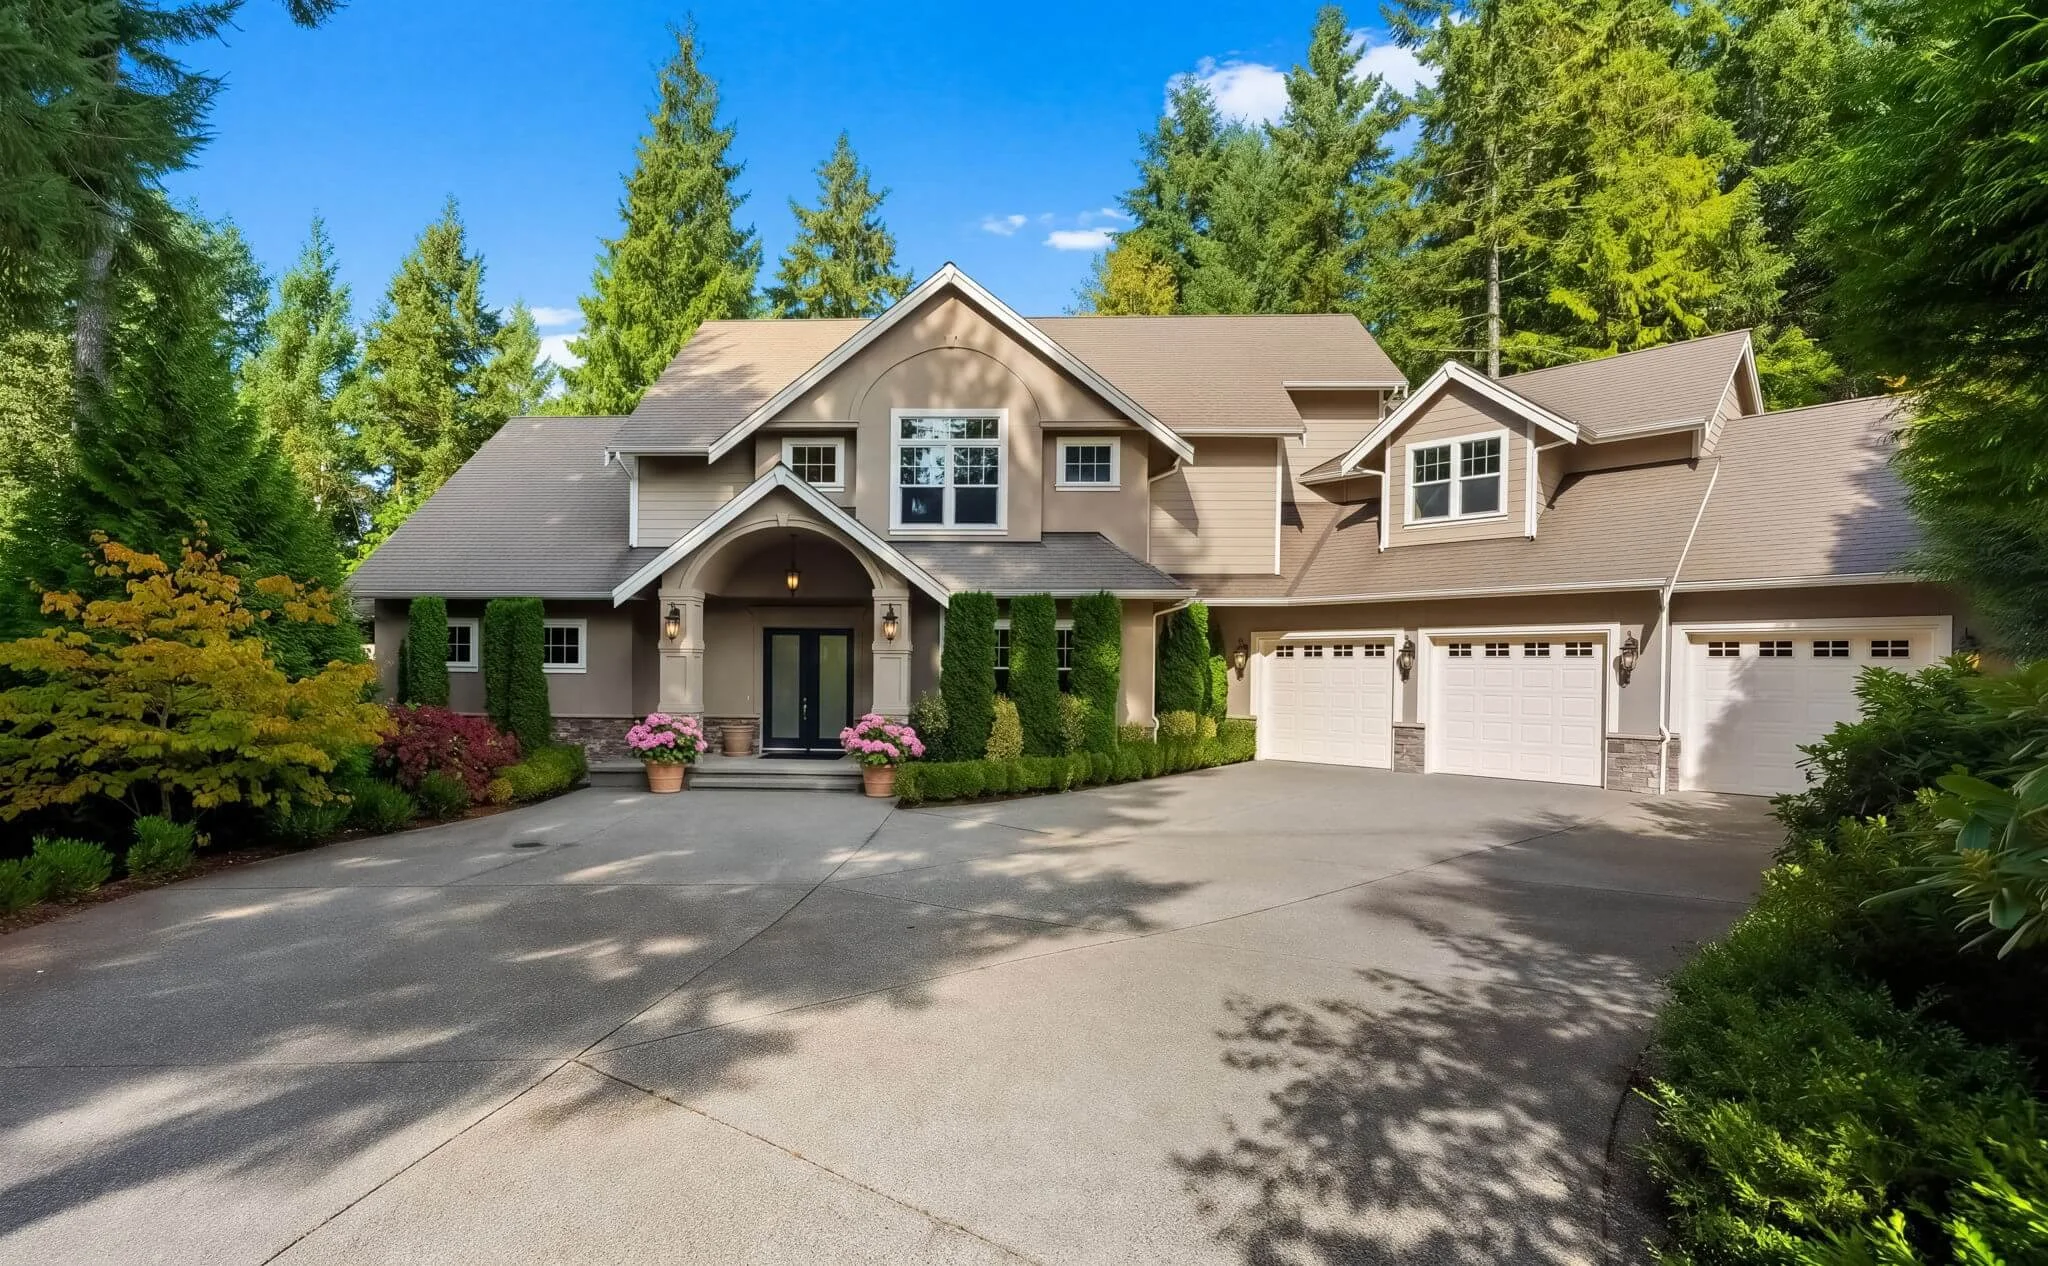
Canterwood's highest sale of 2026, $2,700,000 on Saddleback Drive, never appeared on the MLS. Four Canterwood homes sold off-market this year, at a median of $2,012,500 and $599 per square foot, well above the community's $436 median. For buyers looking at the upper end of Canterwood, some of the best opportunities are never publicly listed.
What it means for 2027
If you are selling: price against what Canterwood buyers have actually paid, not against today's asking prices. Finish the updates that matter before you list, and launch with full preparation on day one. With about 2.5 months of supply, homes priced to the market have been selling in about two weeks since June. Sales peaked in the third quarter with 17 closings and slowed to two so far in the fourth, and this year's longest market times came from homes that sold in winter and early spring. Plan now for a spring launch.
If you are buying: expect the best-priced homes to move within days, so be ready with financing and a strong first offer. Homes that have been on the market for months often have room to negotiate. And ask about homes that aren't publicly listed.
Join the Private List | Request a Private Consultation
Source: Northwest Multiple Listing Service, Canterwood community (NWMLS Area 8, Gig Harbor North). Residential sales closed January 1 to November 17, 2026, including four sales recorded without a public listing; active and pending listings as of November 16, 2026. Days on market are cumulative. Information deemed reliable but not guaranteed.